Note
Click here to download the full example code
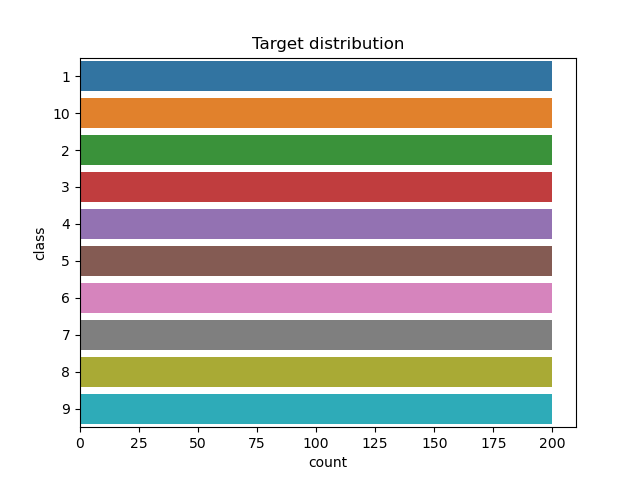
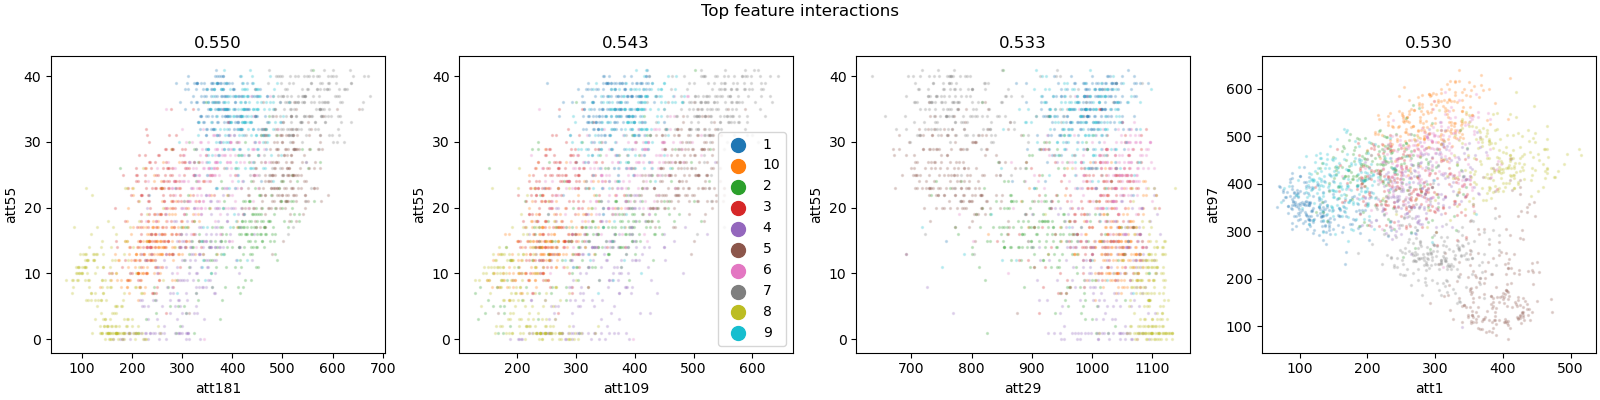
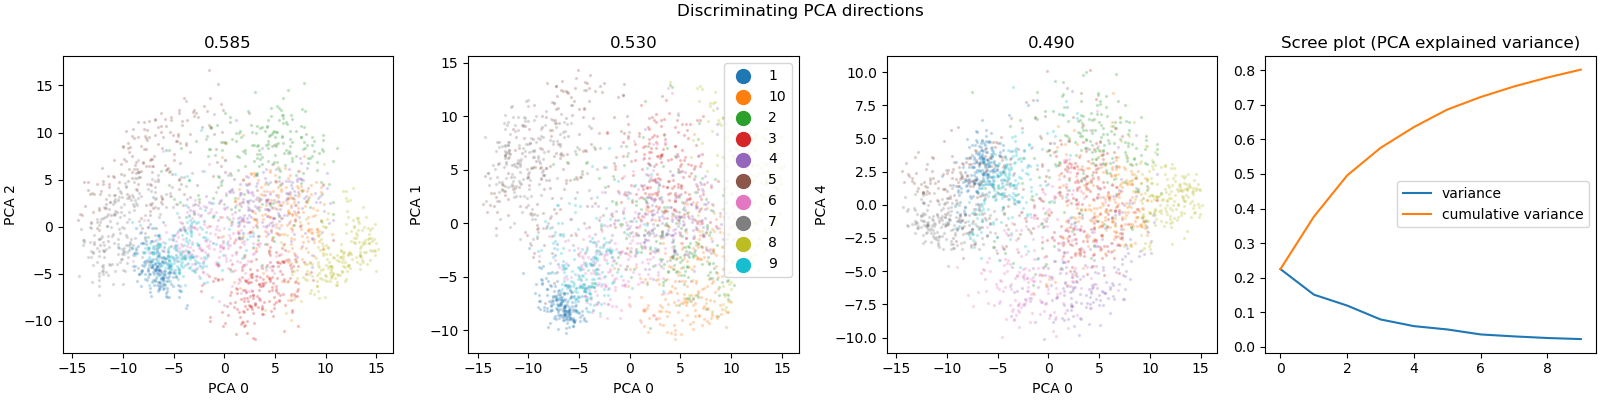
mfeat-factors dataset visualization
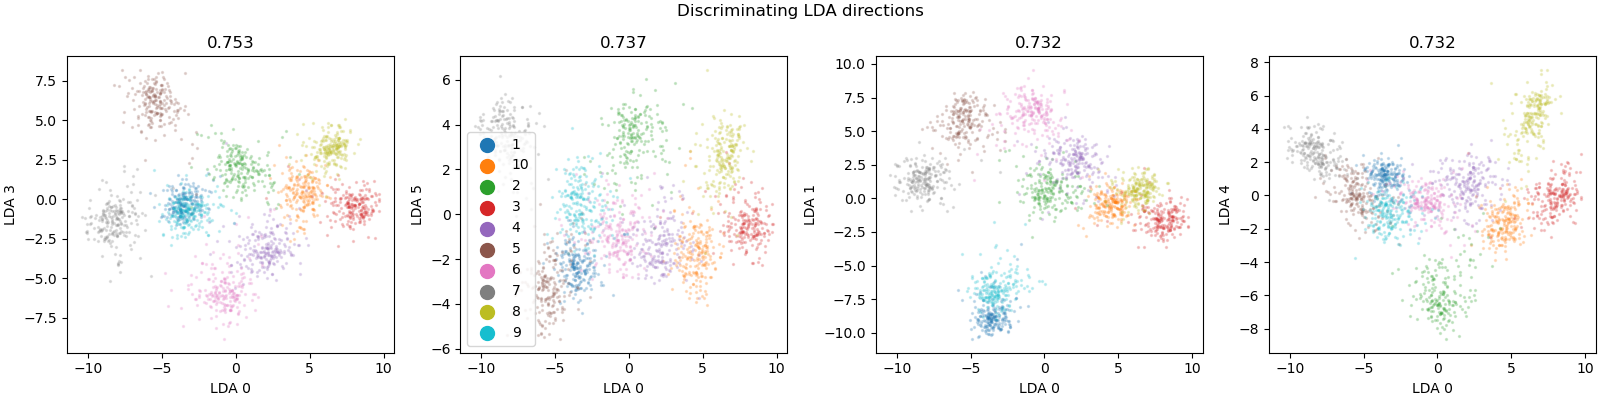
A multiclass dataset with 10 classes. Linear discriminant analysis works surprisingly well!

Out:
/home/circleci/miniconda/envs/testenv/lib/python3.9/site-packages/sklearn/datasets/_openml.py:404: UserWarning: Multiple active versions of the dataset matching the name mfeat-factors exist. Versions may be fundamentally different, returning version 1.
  warn("Multiple active versions of the dataset matching the name"
Target looks like classification
Showing only top 10 of 216 continuous features
Linear Discriminant Analysis training set score: 0.993
# sphinx_gallery_thumbnail_number = 5
import matplotlib.pyplot as plt
from sklearn.datasets import fetch_openml
from dabl import plot

X, y = fetch_openml('mfeat-factors', as_frame=True, return_X_y=True)

plot(X, y)
plt.show()
Total running time of the script: ( 0 minutes 22.287 seconds)