Note
Click here to download the full example code
Ames Housing Dataset Visualization
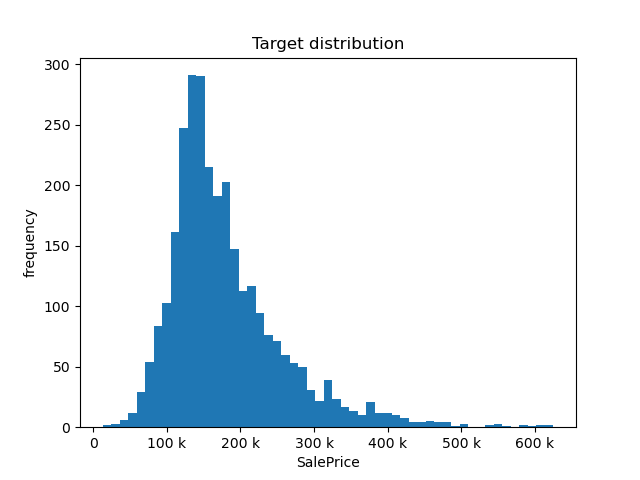
Target looks like regression
/home/circleci/project/dabl/plot/utils.py:692: UserWarning: Dropped 2 outliers in column SalePrice.
warn("Dropped {} outliers in column {}.".format(
/home/circleci/project/dabl/plot/supervised.py:652: UserWarning: Discarding 2 outliers in target column.
warn(f"Discarding {n_outliers} outliers in target column.",
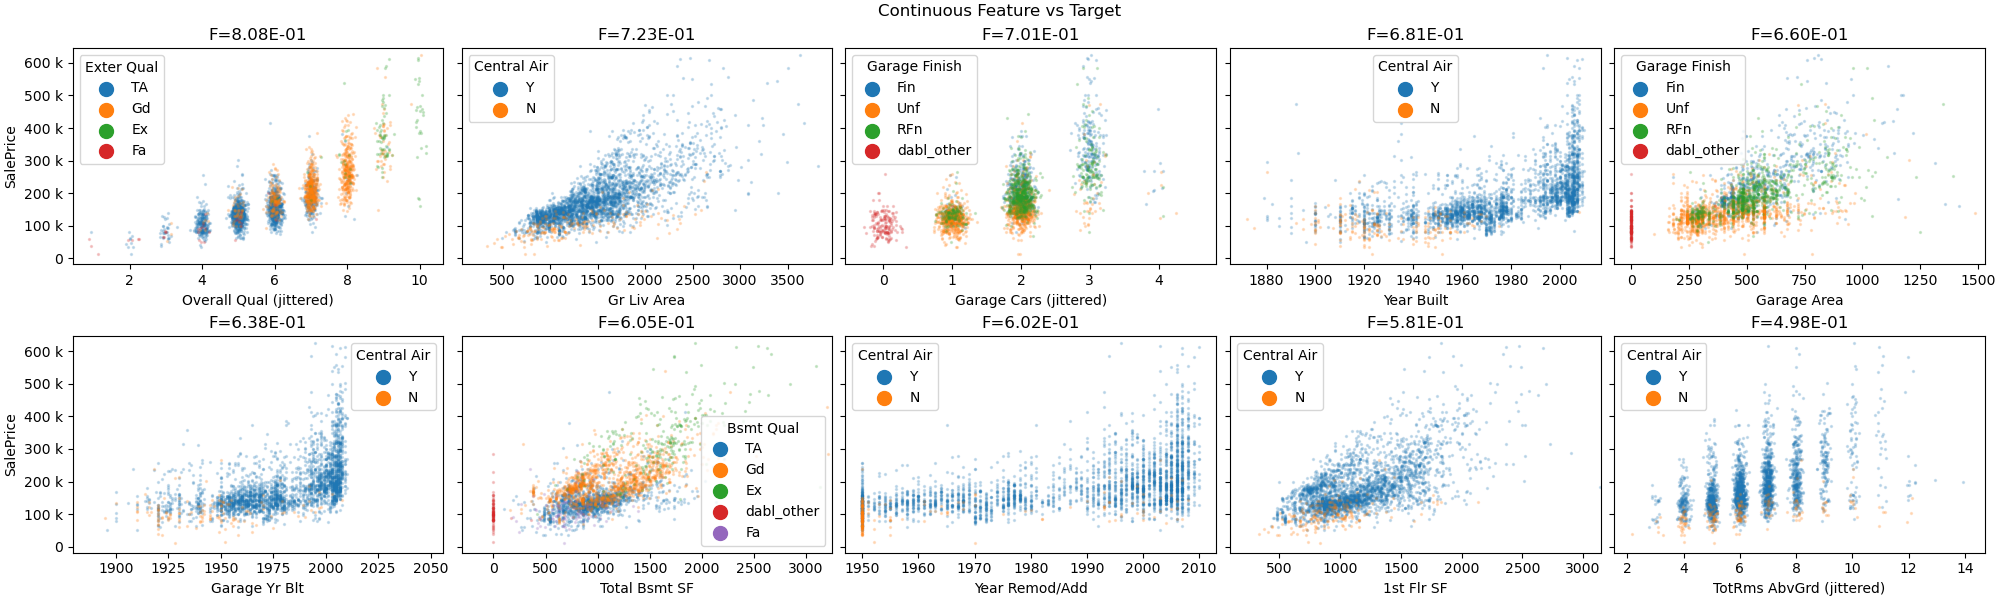
/home/circleci/project/dabl/plot/supervised.py:111: UserWarning: Showing only top 10 continuous features.
warn("Showing only top 10 continuous features.")
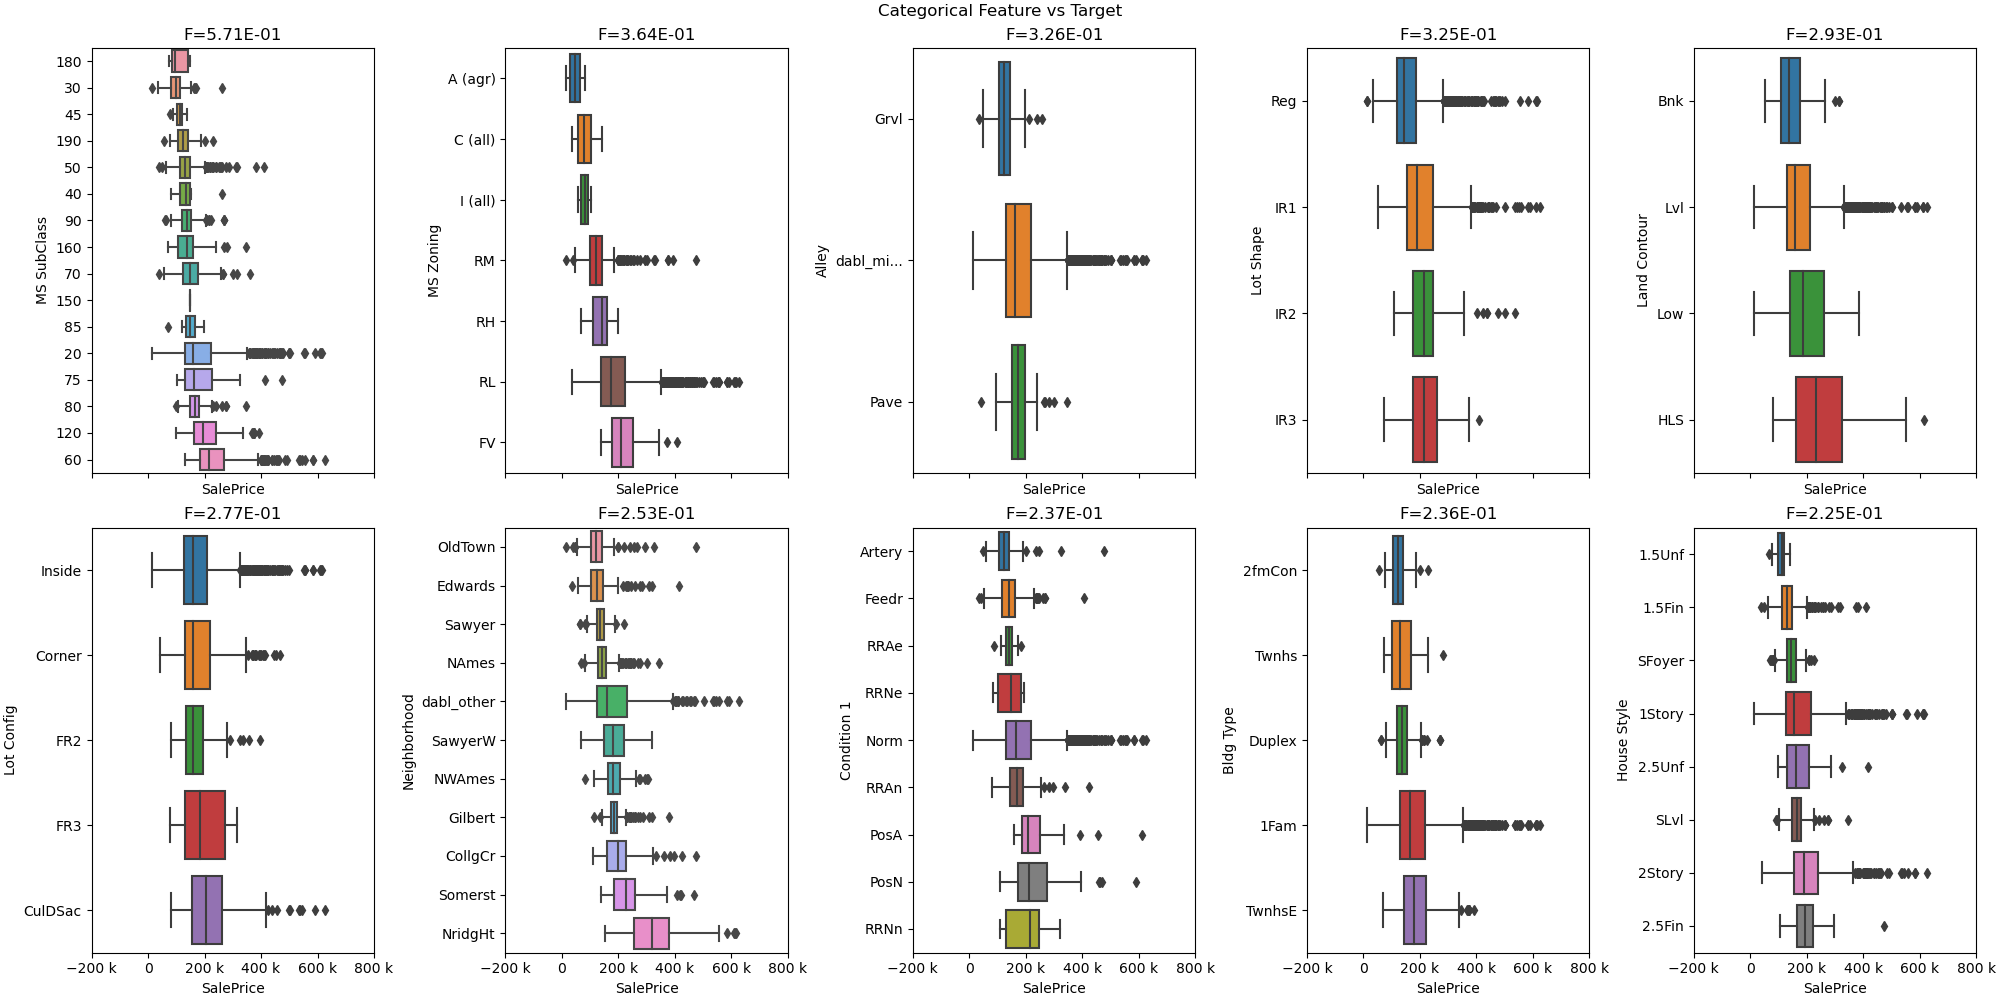
Showing only top 10 of 41 categorical features
# sphinx_gallery_thumbnail_number = 3
from dabl import plot
from dabl.datasets import load_ames
import matplotlib.pyplot as plt

# load the ames housing dataset
# returns a plain dataframe
data = load_ames()

plot(data, target_col='SalePrice')
plt.show()
Total running time of the script: ( 0 minutes 20.215 seconds)