Welcome to dabl, the Data Analysis Baseline Library
This project tries to help make supervised machine learning more accessible for beginners, and reduce boiler plate for common tasks.
This library is in very active development, so it’s not recommended for production use.
Development at github.com/dabl/dabl.
Examples
A minimum example of using dabl for classification is:
>>> import dabl
>>> from sklearn.model_selection import train_test_split
>>> from sklearn.datasets import load_digits
>>> X, y = load_digits(return_X_y=True)
>>> X_train, X_test, y_train, y_test = train_test_split(X, y, random_state=1)
>>> sc = dabl.SimpleClassifier().fit(X_train, y_train)
Running ...
>>> print("Accuracy score", sc.score(X_test, y_test))
Accuracy score 0.9...
This will return increasingly better results immediately and should conclude within several seconds with an accuracy of 0.98.
The real strength of dabl is in providing simple interfaces for data exploration.
Here are some examples of visualizations produced simply by calling plot(X, y):
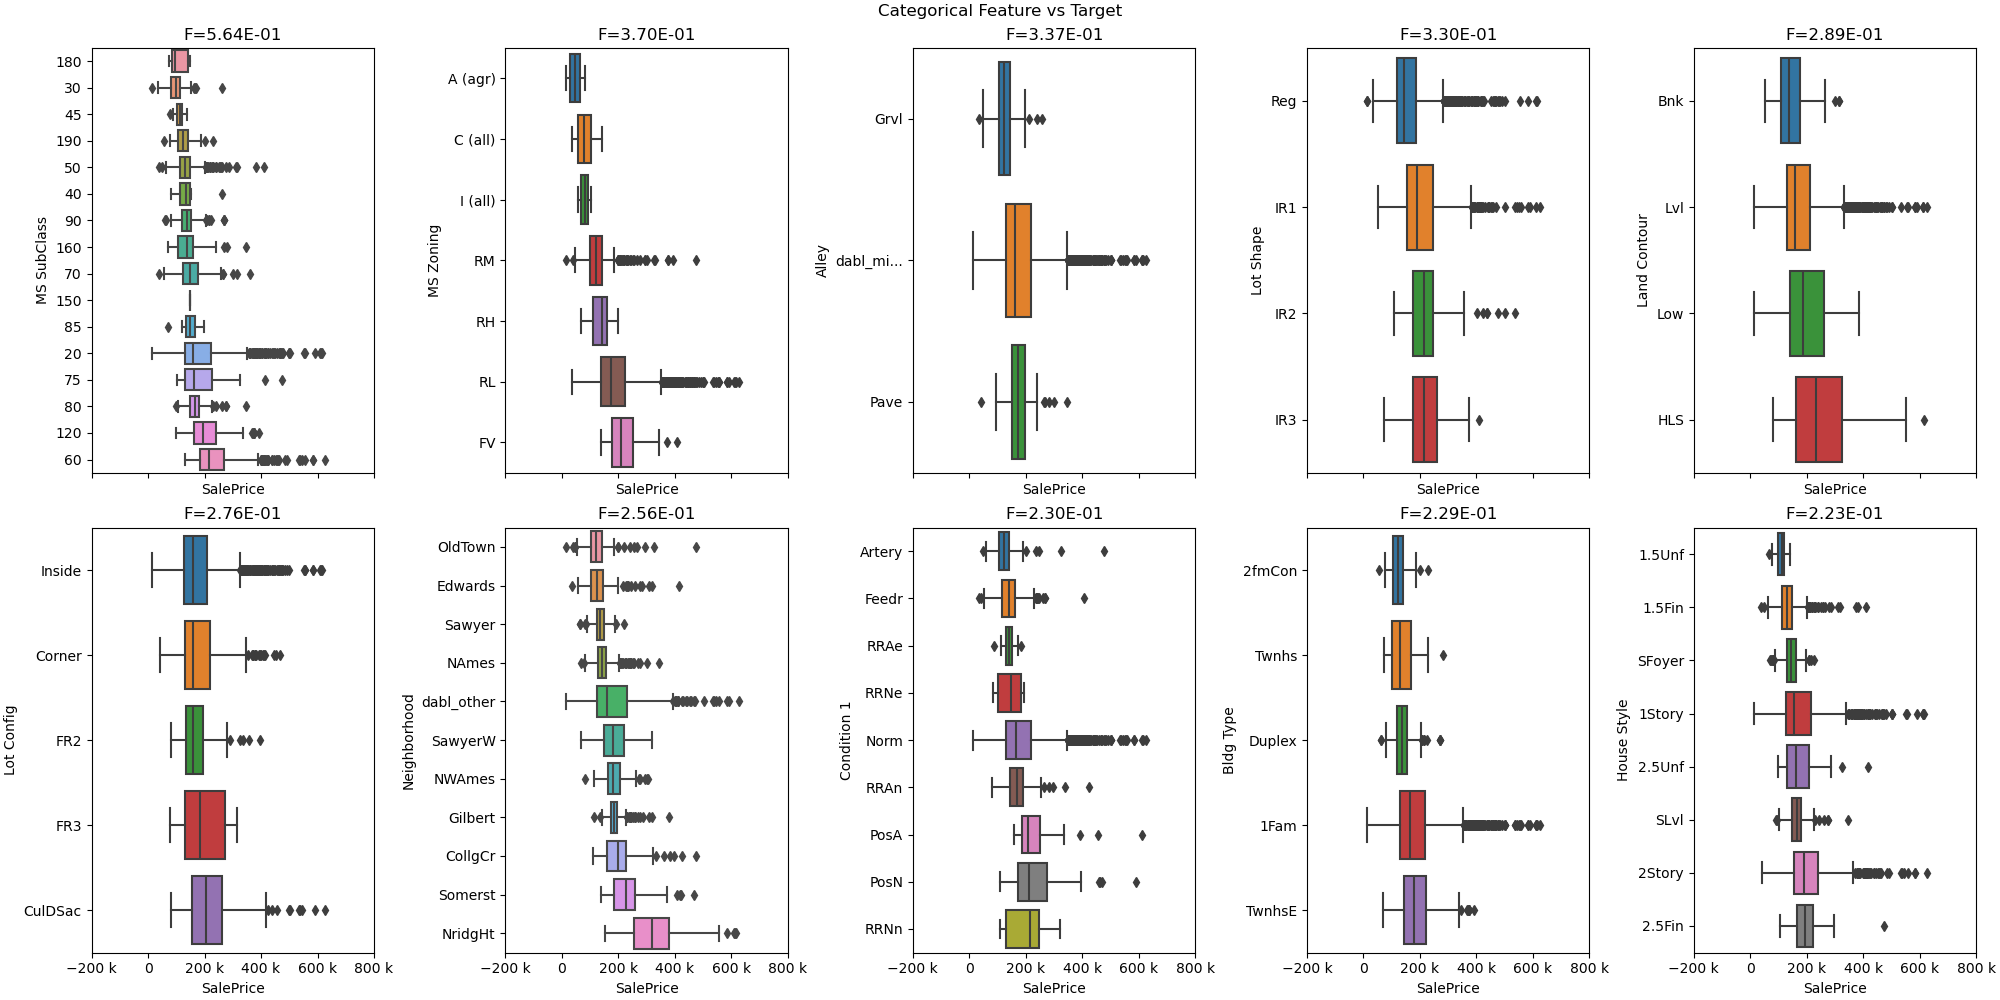
Impact of categorical variables in the ames housing regression dataset.
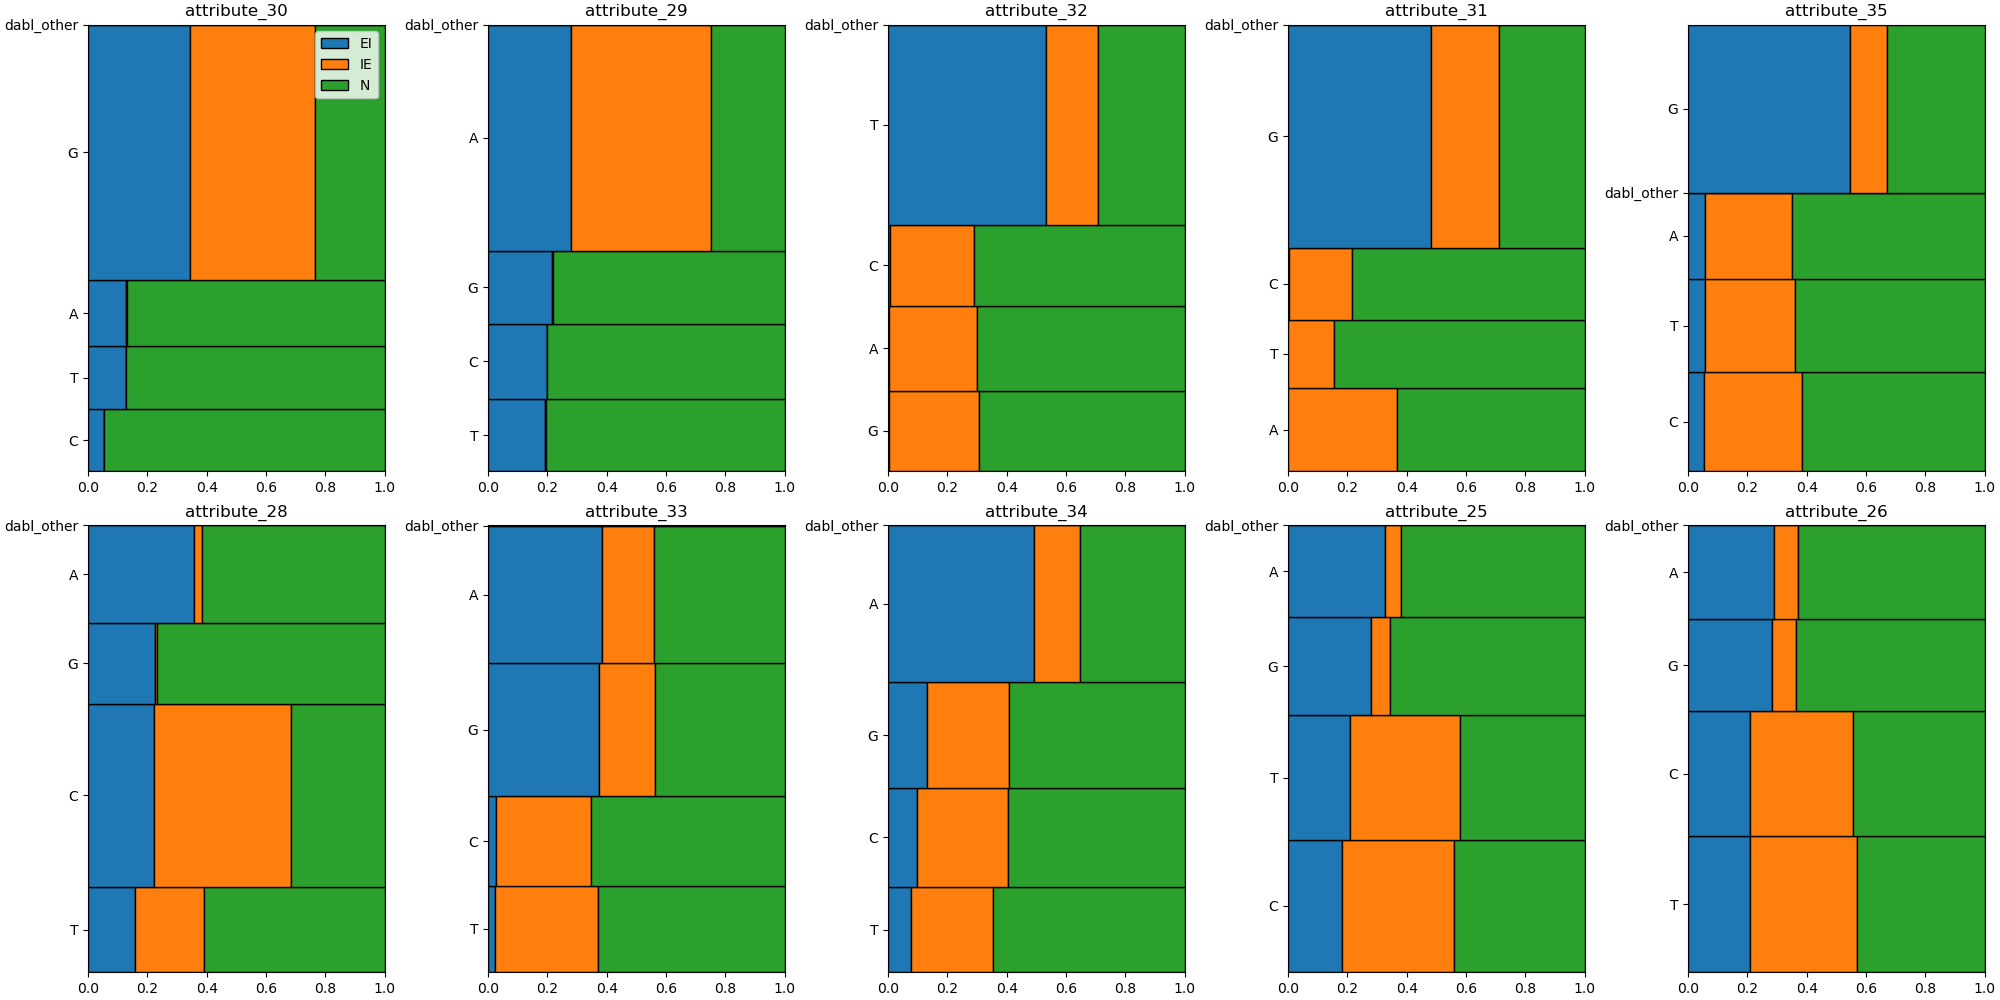
Mosaic plot of the categorical variables in the splice classification task.
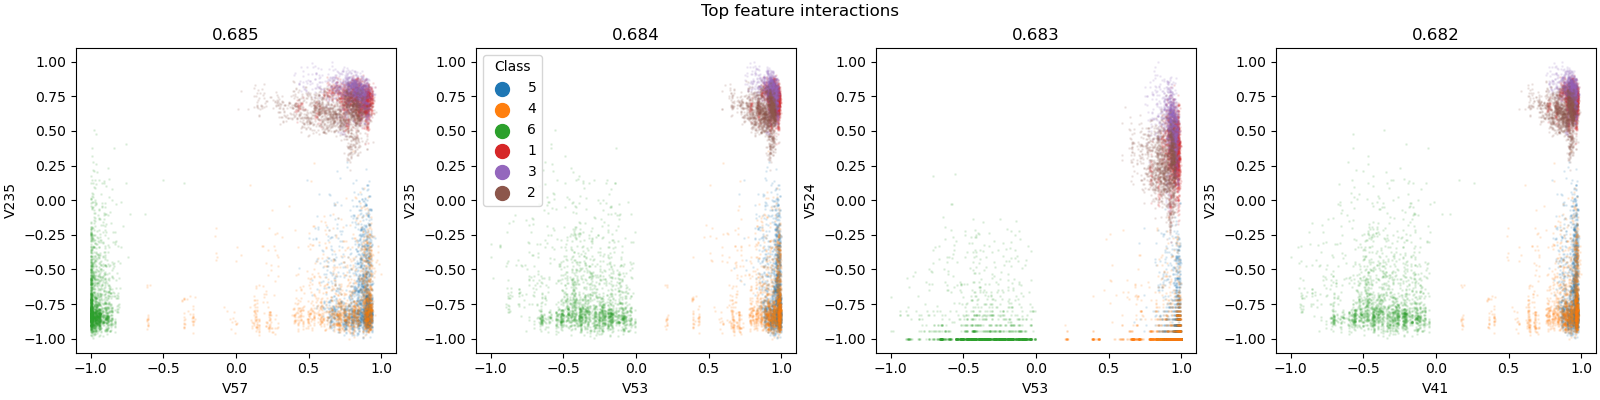
Interesting pairplots are automatically found, such as here for the human activity classification dataset.
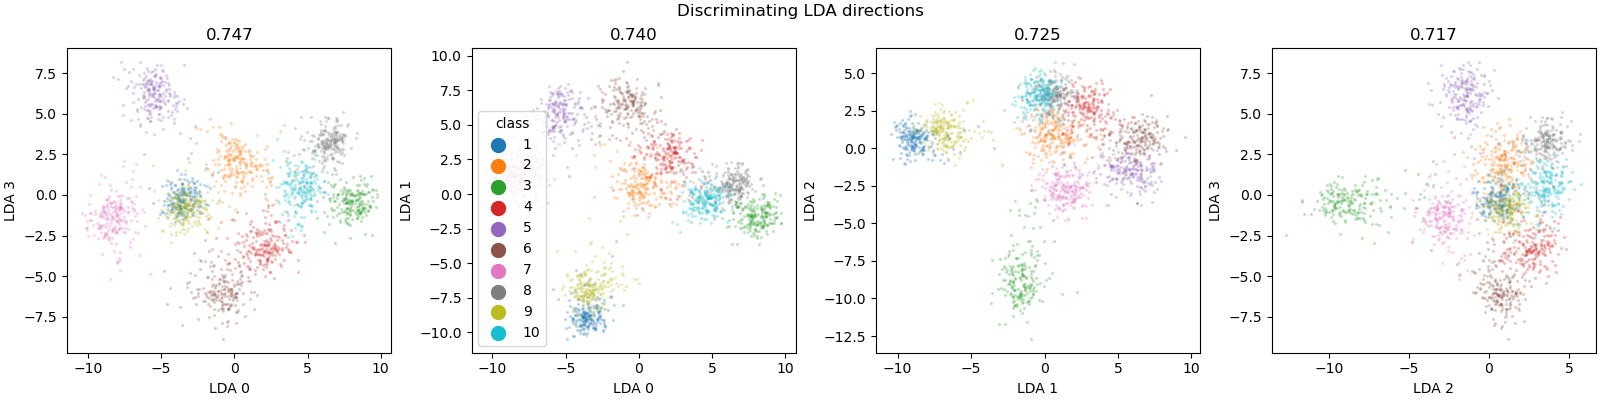
Often Linear Discriminant Analysis can find interesting linear projections of the data. Here on the mfeat-factors dataset most of the 10 classes can be well separated using a 2d projection.