Note
Go to the end to download the full example code
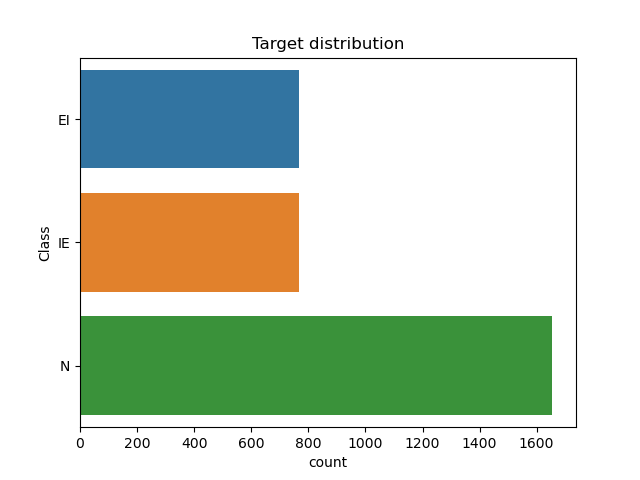
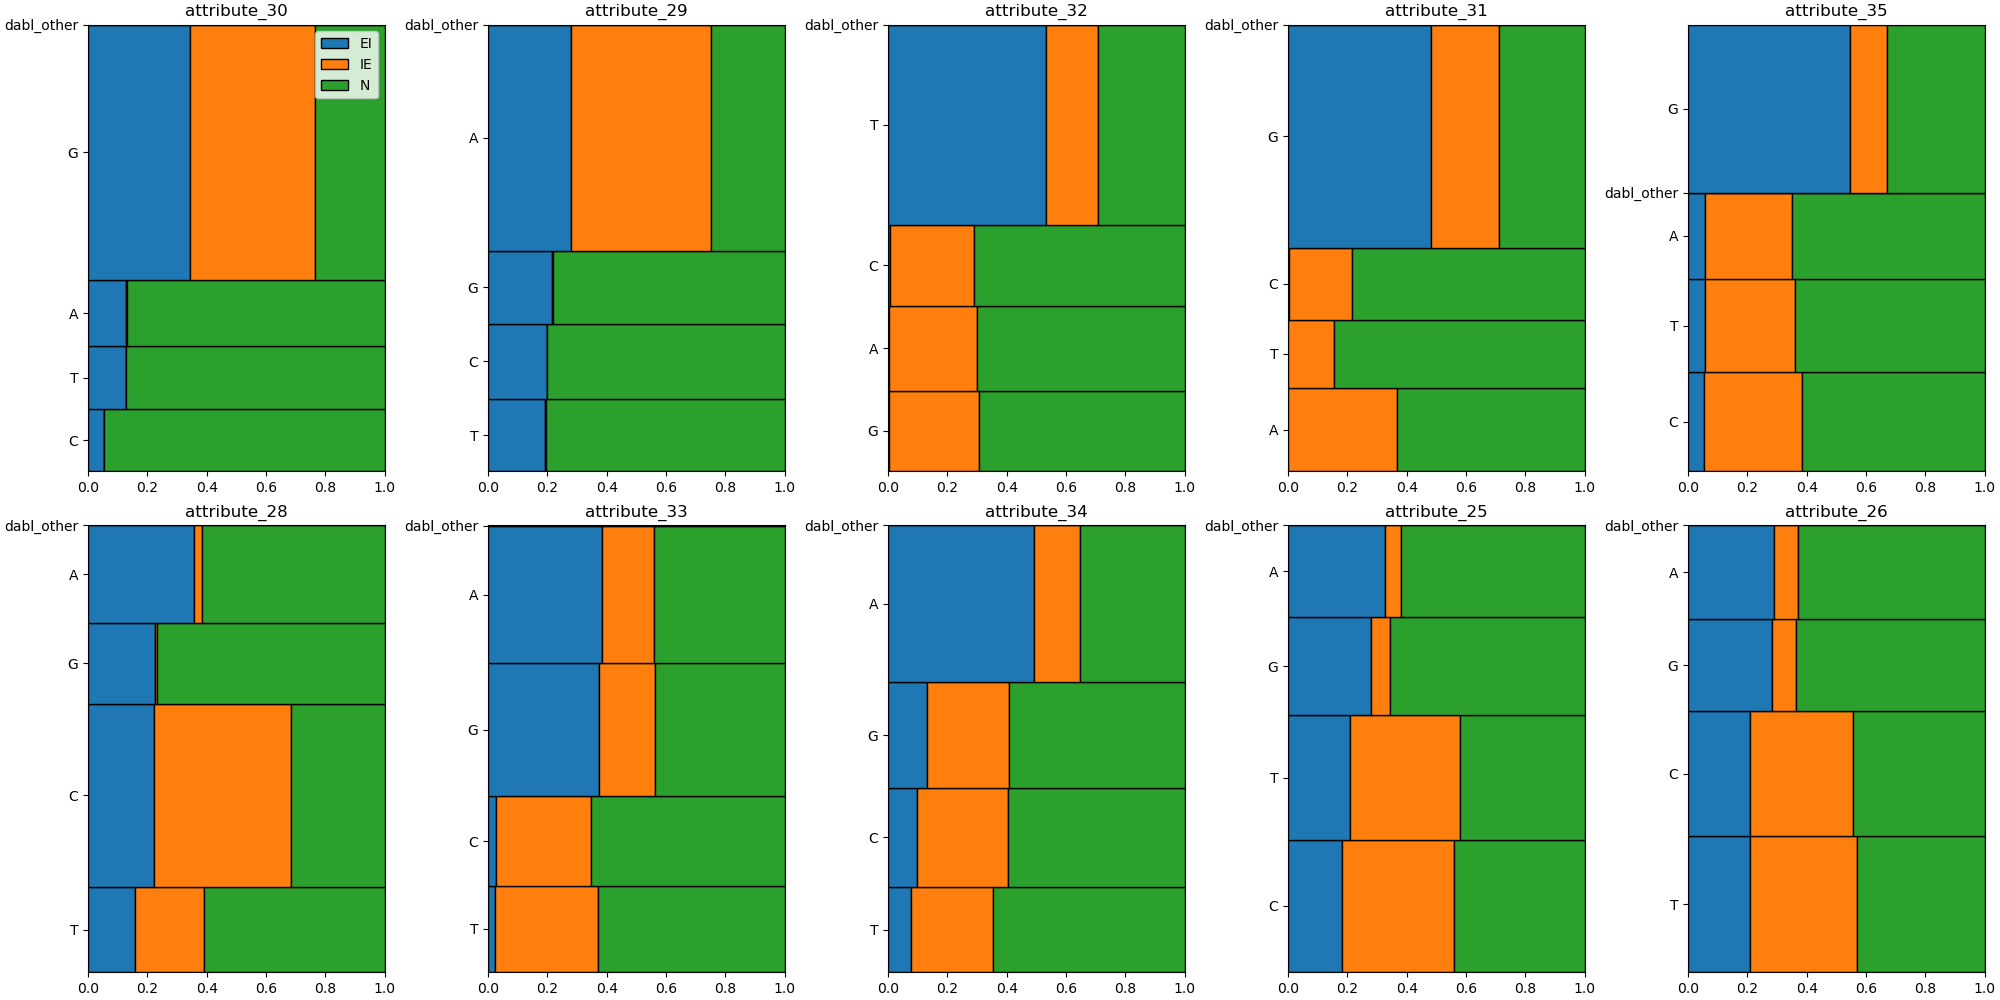
Splice dataset visualization
A nice illustration of the mosaic plot.
/home/circleci/project/~/miniconda/envs/testenv/lib/python3.11/site-packages/sklearn/datasets/_openml.py:322: UserWarning: Multiple active versions of the dataset matching the name splice exist. Versions may be fundamentally different, returning version 1. Available versions:
- version 1, status: active
  url: https://www.openml.org/search?type=data&id=46
- version 2, status: active
  url: https://www.openml.org/search?type=data&id=953

  warn(warning_msg)
Target looks like classification
/home/circleci/project/~/miniconda/envs/testenv/lib/python3.11/site-packages/seaborn/categorical.py:641: FutureWarning: The default of observed=False is deprecated and will be changed to True in a future version of pandas. Pass observed=False to retain current behavior or observed=True to adopt the future default and silence this warning.
  grouped_vals = vals.groupby(grouper)
Showing only top 10 of 60 categorical features
# sphinx_gallery_thumbnail_number = 2
import matplotlib.pyplot as plt
from sklearn.datasets import fetch_openml
from dabl import plot

X, y = fetch_openml('splice', as_frame=True, return_X_y=True)

plot(X, y)
plt.show()
Total running time of the script: (0 minutes 9.567 seconds)