Note
Click here to download the full example code
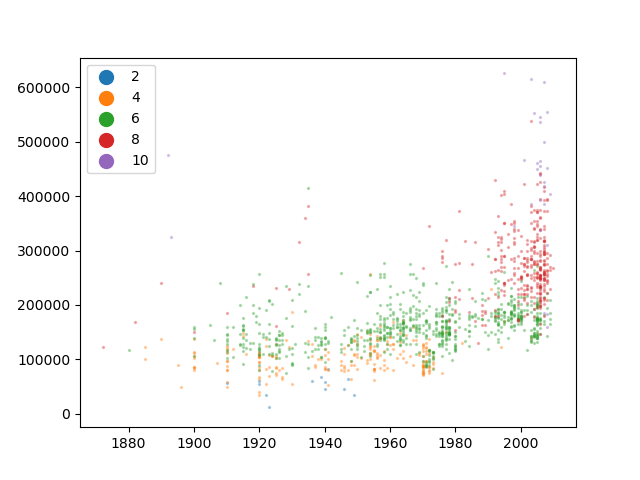
Discrete Scatter Example

import matplotlib.pyplot as plt
from dabl.datasets import load_ames
from dabl.plot import discrete_scatter

data = load_ames()

# Scatter plot for year built and house price grouped by category of quality.
discrete_scatter(
    x=data["Year Built"],
    y=data["SalePrice"],
    c=data["Overall Qual"],
    unique_c=[2, 4, 6, 8, 10],
    legend=True,
    alpha=0.3
)
plt.show()
Total running time of the script: ( 0 minutes 0.181 seconds)