Note
Click here to download the full example code
Splice dataset visualization
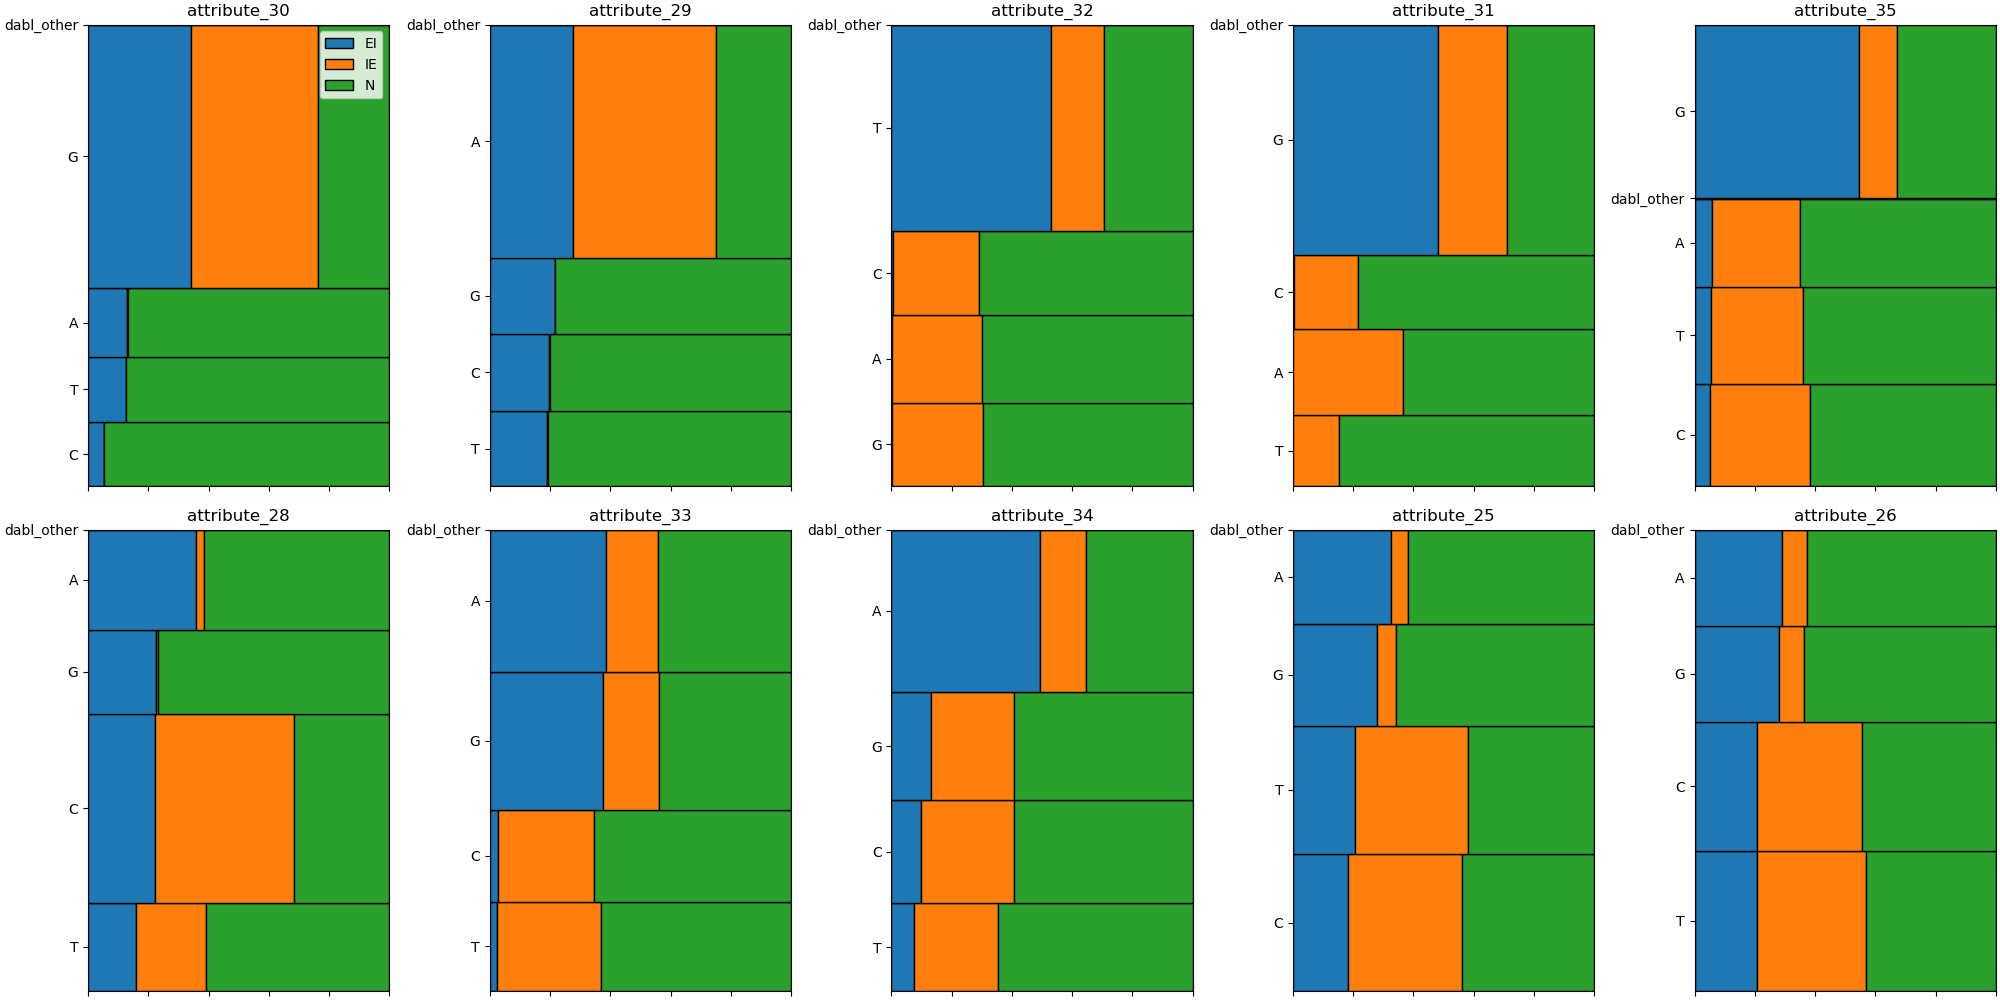
A nice illustration of the mosaic plot.
Out:
/home/circleci/miniconda/envs/testenv/lib/python3.8/site-packages/sklearn/datasets/_openml.py:373: UserWarning: Multiple active versions of the dataset matching the name splice exist. Versions may be fundamentally different, returning version 1.
  warn("Multiple active versions of the dataset matching the name"
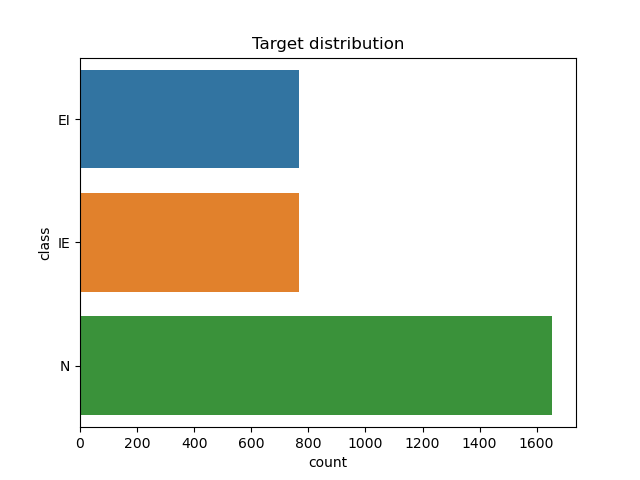
Target looks like classification
Showing only top 10 of 60 categorical features
/home/circleci/project/dabl/plot/utils.py:371: UserWarning: FixedFormatter should only be used together with FixedLocator
  ax.set_xticklabels(
/home/circleci/project/dabl/plot/utils.py:371: UserWarning: FixedFormatter should only be used together with FixedLocator
  ax.set_xticklabels(
/home/circleci/project/dabl/plot/utils.py:371: UserWarning: FixedFormatter should only be used together with FixedLocator
  ax.set_xticklabels(
/home/circleci/project/dabl/plot/utils.py:371: UserWarning: FixedFormatter should only be used together with FixedLocator
  ax.set_xticklabels(
/home/circleci/project/dabl/plot/utils.py:371: UserWarning: FixedFormatter should only be used together with FixedLocator
  ax.set_xticklabels(
/home/circleci/project/dabl/plot/utils.py:371: UserWarning: FixedFormatter should only be used together with FixedLocator
  ax.set_xticklabels(
/home/circleci/project/dabl/plot/utils.py:371: UserWarning: FixedFormatter should only be used together with FixedLocator
  ax.set_xticklabels(
/home/circleci/project/dabl/plot/utils.py:371: UserWarning: FixedFormatter should only be used together with FixedLocator
  ax.set_xticklabels(
/home/circleci/project/dabl/plot/utils.py:371: UserWarning: FixedFormatter should only be used together with FixedLocator
  ax.set_xticklabels(
/home/circleci/project/dabl/plot/utils.py:371: UserWarning: FixedFormatter should only be used together with FixedLocator
  ax.set_xticklabels(
# sphinx_gallery_thumbnail_number = 2
import matplotlib.pyplot as plt
from sklearn.datasets import fetch_openml
from dabl import plot

X, y = fetch_openml('splice', as_frame=True, return_X_y=True)

plot(X, y)
plt.show()
Total running time of the script: ( 0 minutes 3.775 seconds)

