Note
Click here to download the full example code
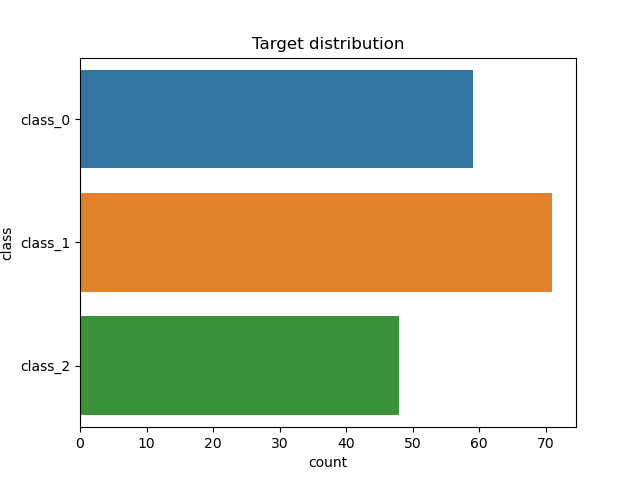
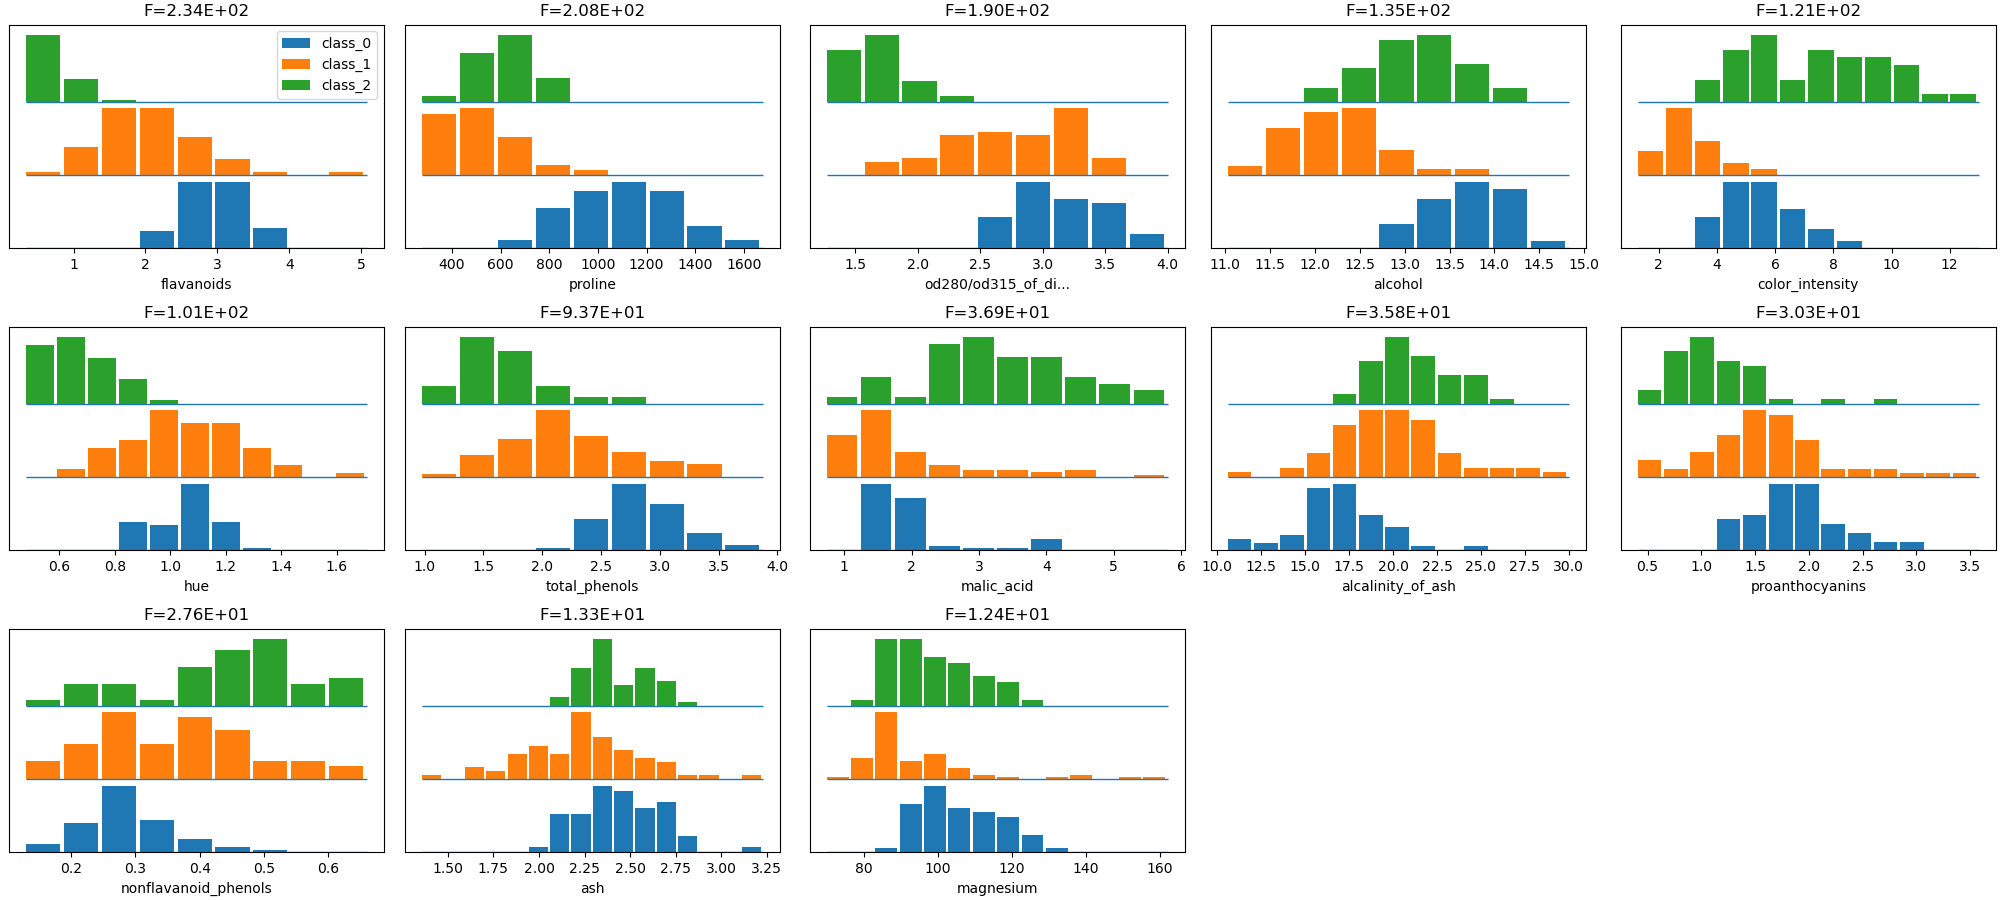
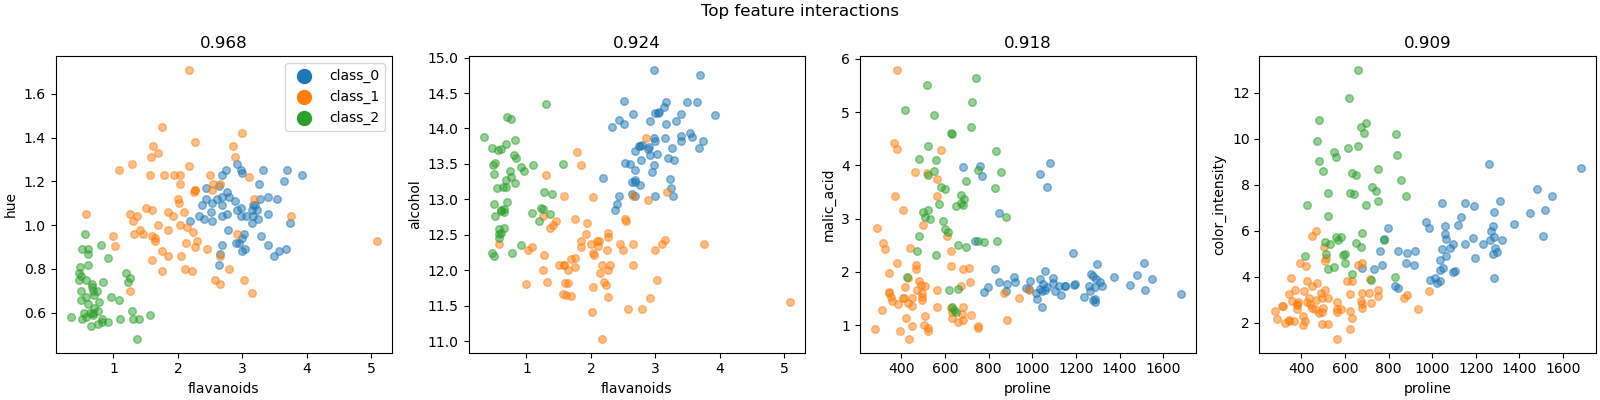
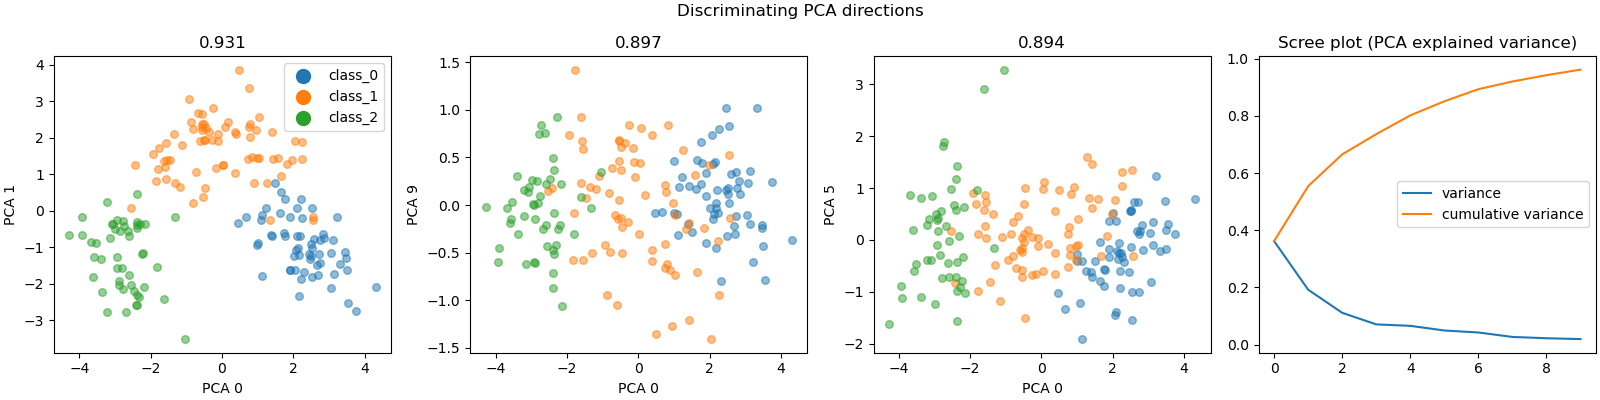
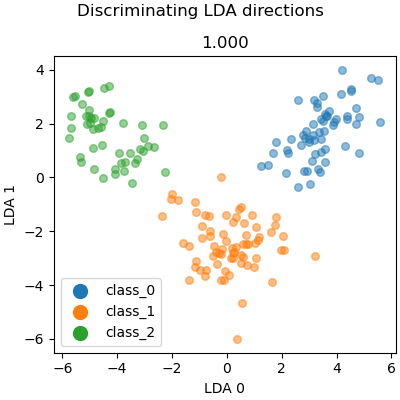
Wine Classification Dataset Visualization
Out:
/home/circleci/project/dabl/plot/supervised.py:538: FutureWarning: The second positional argument of plot is a Series 'y'. If passing a column name, use a keyword.
  warnings.warn("The second positional argument of plot is a Series 'y'."
Target looks like classification
Linear Discriminant Analysis training set score: 1.000
# sphinx_gallery_thumbnail_number = 4
import matplotlib.pyplot as plt
from sklearn.datasets import load_wine
from dabl import plot
from dabl.utils import data_df_from_bunch

wine_bunch = load_wine()
wine_df = data_df_from_bunch(wine_bunch)

plot(wine_df, 'target')
plt.show()
Total running time of the script: ( 0 minutes 3.362 seconds)