Note
Go to the end to download the full example code
Mosaic Plot Example
import matplotlib.pyplot as plt
from dabl.datasets import load_titanic
from dabl.plot import mosaic_plot
data = load_titanic()
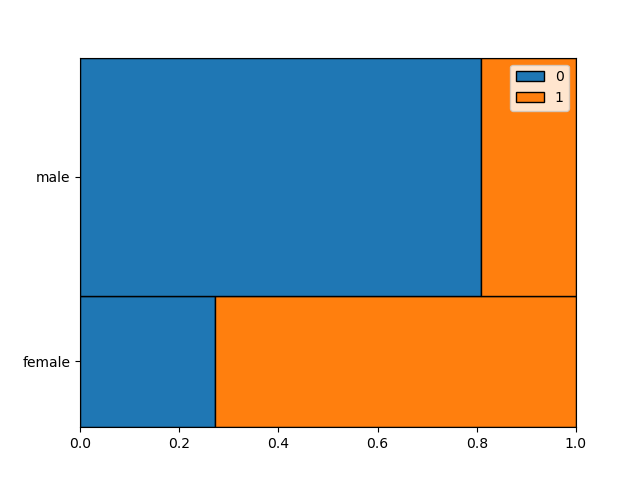
# Mosaic plot for frequencies of Titanic passengers grouped
# by gender and survival status
mosaic_plot(data, 'sex', 'survived')
plt.show()
Total running time of the script: (0 minutes 0.051 seconds)